Recently, I installed some 10GB cards into an AFF8040 so I could run some FlexGroup performance tests (stay tuned for that). I was able to install the cards myself, but to get them connected to a network here at NetApp’s internal labs, you have to file a ticket. This should sound familiar to many people, as this is how real-world IT works.
So I filed the ticket and eventually, the cards were connected. However, just like in real-world IT, the network team has no idea what the storage team (me) has configured, and the storage team (me) has no idea how the network team has things configured. So we had to troubleshoot a bit to get the cards to ping correctly. Turns out, they had a vlan tag on the ports that weren’t needed. Removed those and fixed the port channel and cool! We now had two 10GB LACP interfaces on a 2 node cluster!
Not so fast…
Turns out, ping is a great test for basic connectivity. But it’s awful for checking if stuff *actually works.* In this case, I could ping via the 10GB interfaces and even mount via NFSv3 and list directories, etc. But those are lightweight metadata operations.
Whenever I tried a heavier operation like a READ, WRITE or READDIRPLUS (incidentally, tab completion for a path when typing a command on an NFS mount? READDIRPLUS call), the client would hang indefinitely. When I would CTL + C out of the command, the process would sometimes also hang. And subsequent operations, including the GETATTR, LOOKUP, etc operations would also hang.
So, now I had a robust network that couldn’t even perform tab completions.
Narrowing down the issue
I like to start with a packet trace, as that gives me a hint where to focus my efforts. In this issue, I started a packet capture on both the client (10.63.150.161) and the cluster (10.193.67.218). In the traces, I saw some duplicate ACKs, as well as packets being sent but not replied to:

In the corresponding filer trace, I saw the READDIRPLUS call come in and get replied to, and then re-transmitted a bunch of times. But, as the trace above shows, the client never receives it.
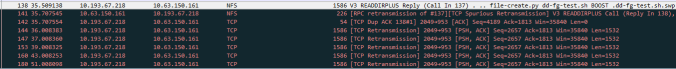
That means the filer is doing what it’s supposed to. The client is doing what it’s supposed to. But the network is blocking or dropping the packet for some reason.
When troubleshooting any issue, you have to start with a few basic steps (even though I like to start with the more complicated packet capture).
For instance…
What changed?
Well, this one was easy – I had added an entire new network into the mix. End to end. My previous ports were 1GB and worked fine. This was 10GB infrastructure, with LACP and jumbo frames. And I had no control over that network. Thus, I was left with client and server troubleshooting for now. I didn’t want to file another ticket before I had done my due diligence, in case I had done something stupid (totally within the realm of possibility, naturally).
So where did I go from there?
Start at layers 1, 2 and 3
The OSI model is something I used to take for granted as something interviewers asked because it seemed like a good question to stump people on. However, over the course of the last 10 years, I’ve come to realize it’s useful. What I was troubleshooting was NFS, which is all the way at layer 7 (the application layer).
![osi-network-layer-cats[1]](https://whyistheinternetbroken.files.wordpress.com/2017/03/osi-network-layer-cats1.jpg?w=285&h=402)
So why start at layers 1-3? Why not start where my problem is?
Because with years of experience, you learn that the issue is rarely at the layer you’re seeing the issue manifest. It’s almost always farther down the stack. Where do you think the “Is it plugged in?” joke comes from?

Layer 1 means, essentially, is it plugged in? In this case, yes, it was. But it also means “are we seeing errors on the interfaces that are plugged in?” In ONTAP, you can see that with this command:
ontap9-tme-8040::*> node run * ifstat e2a
Node: ontap9-tme-8040-01

-- interface e2a (8 days, 23 hours, 14 minutes, 30 seconds) --

RECEIVE
 Frames/second: 1 | Bytes/second: 30 | Errors/minute: 0
 Discards/minute: 0 | Total frames: 84295 | Total bytes: 7114k
 Total errors: 0 | Total discards: 0 | Multi/broadcast: 0
 No buffers: 0 | Non-primary u/c: 0 | L2 terminate: 9709
 Tag drop: 0 | Vlan tag drop: 0 | Vlan untag drop: 0
 Vlan forwards: 0 | CRC errors: 0 | Runt frames: 0
 Fragment: 0 | Long frames: 0 | Jabber: 0
 Error symbol: 0 | Illegal symbol: 0 | Bus overruns: 0
 Queue drop: 0 | Xon: 0 | Xoff: 0
 Jumbo: 0 | JMBuf RxFrames: 0 | JMBuf DrvCopy: 0
TRANSMIT
 Frames/second: 82676 | Bytes/second: 33299k | Errors/minute: 0
 Discards/minute: 0 | Total frames: 270m | Total bytes: 1080g
 Total errors: 0 | Total discards: 0 | Multi/broadcast: 4496
 Queue overflows: 0 | No buffers: 0 | Xon: 0
 Xoff: 0 | Jumbo: 13 | TSO non-TCP drop: 0
 Split hdr drop: 0 | Pktlen: 0 | Timeout: 0
 Timeout1: 0 | Stray Cluster Pk: 0
DEVICE
 Rx MBuf Sz: Large (3k)
LINK_INFO
 Current state: up | Up to downs: 22 | Speed: 10000m
 Duplex: full | Flowcontrol: none
In this case, the interface is pretty clean. No errors, no “no buffers,” no CRC errors, etc. I can also see that the ports are “up.” The up to downs are high, but that’s because I’ve been adding/removing this port from the ifgrp multiple times, which leads me to the next step…
Layer 2/3
Layer 2 includes the LACP/port channel, as well as the MTU settings. Layer 3 can also include pings and some switches, as well as routing.
Since the port channel was a new change, I made sure that the networking team verified that the port channel was configured properly, with the correct ports added to the channel. I also made sure that the MTU was 9216 on the switch ports, as well as the ports on the client and storage. Those all checked out.
However, that doesn’t mean we’re done with layer 2; remember, basic pings worked fine, but those operate at 1500 MTU. That means we’re not actually testing jumbo frames here. The issue with the client was that any NFS operation that was not metadata was never making it back to the client; that suggests a network issue somewhere.
I didn’t mention before, but this cluster also has a properly working 1GB network on 1500 MTU on the same subnet, so that told me routing was likely not an issue. And because the client was able to send the information just fine and had the 10GB established for a while, the issue likely wasn’t on the network segment the client was connected to. The problem resided somewhere between the filer 10GB ports and the new switch the ports were connected to. (Remember… what changed?)
Jumbo frames
From my experience with troubleshooting and general IT knowledge, I knew that for jumbo frames to work properly, they had to be configured up and down the entire stack of the network. I knew the client was configured for jumbo frames properly because it was a known entity that had been chugging along just fine. I also knew that the filer had jumbo frames enabled because I had control over those ports.
What I wasn’t sure of was if the switch had jumbo frames configured for the entire stack. I knew the switch ports were fine, but what about the switch uplinks?
Luckily, ping can tell us. Did you know you could ping using MTU sizes?
Pinging MTU in Windows
To ping using a packet size in Windows, use:
ping -f -l [size] [address]
-f means “don’t fragment the packet.” That means, if I am sending a jumbo frame, don’t break it up into pieces to fit. If you ping using -f and a large MTU, the MTU size needs to be able to squeeze into the network MTU size. If it can’t, you’ll see this:
C:\>ping -f -l 9000 10.193.67.218

Pinging 10.193.67.218 with 9000 bytes of data:
Packet needs to be fragmented but DF set.
Packet needs to be fragmented but DF set.
Packet needs to be fragmented but DF set.
Packet needs to be fragmented but DF set.

Ping statistics for 10.193.67.218:
 Packets: Sent = 4, Received = 0, Lost = 4 (100% loss)
Then, try pinging with only -l (which specifies the packet size). If that fails, you have a good idea that your issue is MTU size. Note: My windows client didn’t have jumbo frames enabled, so I didn’t bother trying to use it to troubleshoot using it.
Pinging MTU in Linux
To ping using a packet size in Linux, use:
ping [-M do] [-s <packet size>] [host]-f, again, means “don’t fragment the packet.” That means, if I am sending a jumbo frame, don’t break it up into pieces to fit. If you ping using -f and a large MTU, the MTU size needs to be able to squeeze into the network MTU size.
-M <hint>: Select Path MTU Discovery strategy.<hint> may be either “do” (prohibit fragmentation, even local one), “want” (do PMTU discovery, fragment locally when packet size is large), or “dont” (do not set DF flag).
Keep in mind that the MTU size you specify won’t be *exactly* 9000; there’s some overhead involved. In the case of Linux, we’re dealing with about 28 bytes. So an MTU of 9000 will actually come across as 9028 and complain about the packet being too long:
# ping -M do -s 9000 10.193.67.218
PING 10.193.67.218 (10.193.67.218) 9000(9028) bytes of data.
ping: local error: Message too long, mtu=9000
Instead, ping jumbo frames using 9000 – 28 = 8972:
# ping -M do -s 8972 10.193.67.218
PING 10.193.67.218 (10.193.67.218) 8972(9000) bytes of data.
^C
--- 10.193.67.218 ping statistics ---
2 packets transmitted, 0 received, 100% packet loss, time 1454ms
In this case, I lost 100% of my packets. Now, let’s ping using 1500 – 28 = 1472:
# ping -M do -s 1472 10.193.67.218
PING 10.193.67.218 (10.193.67.218) 1472(1500) bytes of data.
1480 bytes from 10.193.67.218: icmp_seq=1 ttl=249 time=0.778 ms
^C
--- 10.193.67.218 ping statistics ---
1 packets transmitted, 1 received, 0% packet loss, time 590ms
rtt min/avg/max/mdev = 0.778/0.778/0.778/0.000 ms
All good! Just to make sure, I pinged a known working client that has jumbo frames enabled end to end:
# ping -M do -s 8972 10.63.150.168
PING 10.63.150.168 (10.63.150.168) 8972(9000) bytes of data.
8980 bytes from 10.63.150.168: icmp_seq=1 ttl=64 time=1.12 ms
8980 bytes from 10.63.150.168: icmp_seq=2 ttl=64 time=0.158 ms
^C
--- 10.63.150.168 ping statistics ---
2 packets transmitted, 2 received, 0% packet loss, time 1182ms
rtt min/avg/max/mdev = 0.158/0.639/1.121/0.482 ms
Looks like I have data pointing to jumbo frame configuration as my issue. And if you’ve ever dealt with a networking team, you’d better bring data. 🙂
Resolving the issue
The network team confirmed that the switch uplink was indeed not set to support jumbo frames. The change was going to take a bit of time, so rather than wait until then, I switched my ports to 1500 in the interim and everything was happy again. Once the jumbo frames get enabled on the cluster’s network segment, I can re-enable them on the cluster.
Where else can this issue crop up?
MTU mismatch is a colossal PITA. It’s hard to remember to look for it and hard to diagnose, especially if you don’t have access to all of the infrastructure.
In ONTAP, specifically, I’ve seen MTU mismatch break:
- CIFS setup/performance
- NFS operations
- SnapMirror replication
Pretty much anything you do over a network can be affected, so if you run into a problem all the way up at the application layer, remember the OSI model and start with the following:
- Check layers 1-3
- Ask yourself “what changed?”
- Compare against working configurations, if possible

Interesting way of breaking the issue into smaller segments.
Keep up the good work.
Cheers,
LikeLike
Curious as to why you are using jumbo frames? seems like a configuration nightmare with little performance benefit.
LikeLike
Was going to test jumbo and non-jumbo.
LikeLike
ICMP (Pings) is classified as a layer 3 protocol in the OSI model, not layer 2.
LikeLike
Thanks Dave! Will make the correction.
LikeLike
Nice work!! Clear thinking is required especially when you facing a critical issue for the business. 🙂
LikeLike